
Are you worried due to constant RFIs, surprise utilities, and last‑minute grading changes?
Those issues usually start when teams skip a clear site analysis before drafting begins.
A professional diagram turns scattered facts into one buildable picture for everyone.
First, you see access limits, slopes, and constraints before labor mobilize and material ships.
Next, estimators price the scope with fewer assumptions because the site reads clearly.
Then, architects coordinate with civil plans faster because CAD layers match reality.
Also, the diagram highlights items needing verification, like easements, setbacks, and right‑of‑way edges. Finally, it becomes a shared reference during permitting, preconstruction, and early sitework meetings. Most importantly, builders reduce rework because decisions follow documented site conditions. Keep reading to know more about this topic!
To better understand how coordinated drawings reduce RFIs and field conflicts, you can also read our detailed guide on What is BIM and how it improves construction documentation accuracy.
What is Architecture Site Analysis?
Architecture site analysis is the process of understanding the location of construction. Architects use site analysis to study a location before scaling any lines. It captures physical conditions, legal limits, and neighborhood patterns that shape early decisions.
Teams usually present findings as a site analysis diagram that simplifies complex inputs.
Simply put, it links desktop research, field observations, and consultant reports into one summary.
Why is there a Need for Site Analysis?
The purpose of site analysis is to spot constraints while changes still cost less.
- For contractors, it reduces guesswork on access, staging, and temporary works early.
- For estimators, it clarifies quantities, cut-and-fill assumptions, and utility relocation risk.
- And for architects, it supports orientation, context fit, and code compliance from day one.
You can understand it in a better way by thinking of it in three rings:
- Region
- Neighborhood
- Site boundary itself
Regional ring allows you to track climate, hazards, and infrastructure connections. Neighborhood ring allows you study land use, traffic patterns, and nearby building heights.
And at the site ring, you verify slopes, utilities, and access gates that affect work.
The Role of a Professional Daigram in Construction
● Single Source of Working
A clear diagram gives the whole team one truth, instead of ten conflicting markups. Because it uses scale and symbols, you can coordinate civil, architectural, and landscape drawings. It also helps you explain site constraints and opportunities without a long meeting. That clarity matters when planning frameworks ask teams to respond to constraints and opportunities.
● Visible Legal and Regulatory Context
Furthermore, a professional site analysis diagram includes legal context, so setbacks and easements stay visible. For example, FEMA flood products show mapped flood hazards that can constrain finished floors.
Similarly, right‑of‑way conditions influence driveway placements, turning radii, and construction access. When you draft these limits early, you avoid redesign loops during review.
● Transparent Communications
Owners and permitting staff also respond better when you show issues on one sheet. You can point to a constraint, explain the response, and document the design intent clearly.
Similarly, meeting notes become action items instead of arguments about missing background with these drawings. This approach fits
how planning statements define principles based on earlier analysis.
● Estimators’ Dependency on Accurate Diagram
As you know, estimators hate unknowns; they use the diagram that highlights demolition, relocation, and protection needs. It shows haul routes, laydown zones, and access pinch points that affect productivity. Moreover, it notes stormwater controls, because grading and runoff rules drive scope. Ultimately, you can defend assumptions during bid clarifications with a transparent reference sheet.
● Eliminate Sitework Sequencing and Utility Conflict
Builders can’t sequence sitework without knowing slopes, drainage outlets, and existing utilities. A weak diagram hides a utility conflict until excavation, and crews stop while locating proceeds. If you tag utilities as verified or assumed, project managers plan potholing and protection logically. That practice matters because 811 coordinates markings of buried utilities before digging begins.
● Safety Planning in Advance
A good diagram also supports safety planning, because it highlights traffic exposure and tight edges. Mark steep drops, overhead lines, and pinch points where equipment movement creates real hazards. Then, you can plan fencing, flaggers, and equipment routes before mobilization starts. That preparation reduces improvisation, which often causes avoidable near-misses on busy sites.
● No Late Design Coordination Problems
During design development, teams expect civil and architectural site plans to become generally complete. Therefore, early diagramming prevents late coordination surprises when documents mature for pricing. It also helps you define bid packages, because you can isolate the early sitework scope cleanly.
To better understand how coordinated documentation prevents late-stage conflicts and redesign loops, you can also explore our detailed guide on The Difference Between Design Drawings and Shop Drawings and how drawing clarity directly impacts construction accuracy.
Components of a Professional Site Analysis Diagram
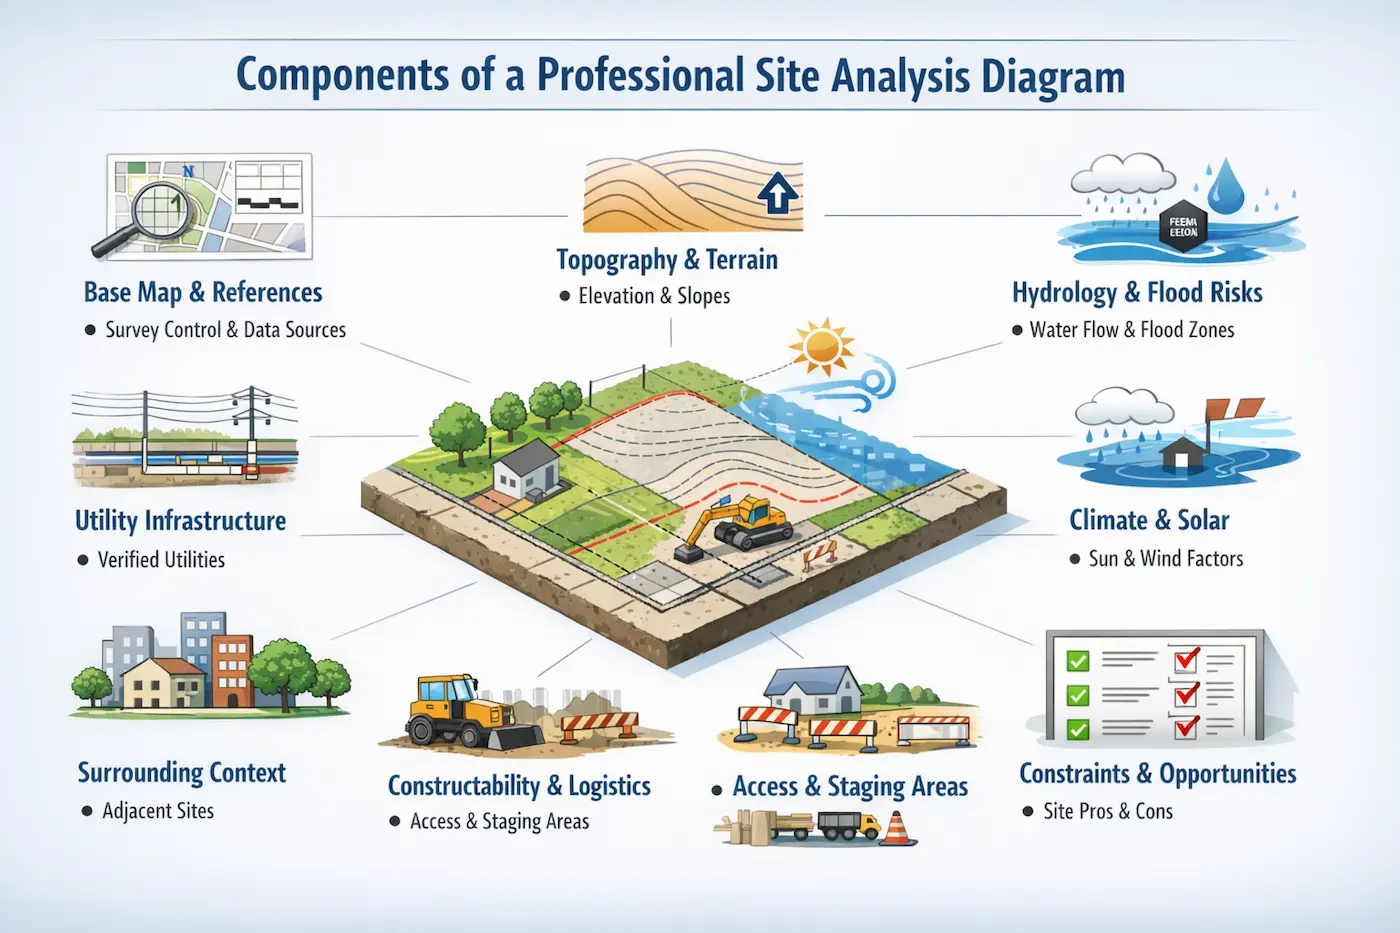
● Base Map and Essential Drawing References
A complete site analysis diagram starts with a base map that matches survey control. Add a north arrow, graphic scale, legend, and a clear list of data sources. Next, show property lines, easements, setbacks, and any right‑of‑way constraints you know. Then, date the sheet and note what you verified onsite versus what you assumed.
● Topography and Terrain Conditions
Topography needs its own layer because slopes drive grading, drainage, and accessibility decisions. Pull contours from authoritative datasets, but never treat GIS contours as survey accuracy. USGS provides GIS downloads and contour services, which help early evaluation and coordination. However, USGS also warns that contour lines can vary by quadrangle and may not match.
● Hydrology and Flood Risk Analysis
Hydrology and flood risk sit right beside topography on most build sites. You need to show flow direction, low points, existing inlets, and nearby channels that influence stormwater planning. Furthermore, add FEMA flood layers when available, and mark the map version you relied on. That simple note keeps everyone honest when flood data updates occur during long projects.
● Utility Infrastructure and Verification
Utilities need special handling because records rarely match what laborers find in trenches.
You must show overhead and underground utilities on separate layers with clear confidence tags. And you can use 811 markings and potholing results to upgrade confidence from record to verified. This way, you reduce utility strikes and redesign scrambles when excavation starts.
● Climate and Solar Exposure Factors
Climate layers look soft, but they change real loads and comfort quickly. Therefore, you must include prevailing wind direction, hot afternoon sun exposure, and shading from nearby buildings in the diagrams. Use climate normals for typical temperature and precipitation expectations in a given region. Also, connect solar exposure to orientation decisions, because passive design uses site and climate.
● Surrounding Context and Urban Conditions
Context layers help laborers and designers understand what neighbors will actually experience. In your drawings, you must show adjacent building heights, window locations, tree canopies, and street activity patterns. Remember to add circulation arrows for vehicles and pedestrians, including delivery paths and emergency access. Also, mark noise sources like highways, because noise affects planning and façade decisions.
● Constructability and Site Logistics
Include a simple constructability layer showing staging zones, stockpiles, and temporary access needs. That layer helps you check whether trucks can turn, stop, and unload without blocking traffic. Also, mark erosion control locations, because permits often demand specific BMPs and inspections.
● Constraints and Opportunities Summary
Ultimately, finish with a short opportunities box that names what the site makes easier. Name items like good solar exposure, simple drainage outlets, or clear visibility for access. Then, highlight constraints beside them, so the reader sees tradeoffs at a glance. This paired view supports principled responses that mitigate constraints and maximize opportunities.
Who Participates in Architecture Site Analysis
● Licensed Land Surveyors
Start with a licensed land surveyor, because boundaries anchor every other decision. ALTA or NSPS standards describe a complete land title survey as fieldwork plus a certified map. That map ties field evidence to records, which helps teams understand easements and access rights. Therefore, request the survey early, and coordinate deliverables with the CAD baseline.
● Civil and Geotechnical Engineers
Next, involve civil engineers to evaluate drainage, grading strategy, and utility service approach. They translate slopes into proposed spot grades, swales, and connections to existing infrastructure.
Also involve geotechnical engineers, because soils and groundwater govern excavation and foundations. Geotechnical reports often evaluate soil and groundwater conditions, then issue design recommendations.
● Environmental and Planning Consultants
Environmental and permitting consultants matter when wetlands, trees, or contamination constrain work. They highlight required permits, inspection needs, and documentation that can affect your schedule.
Meanwhile, traffic or accessibility specialists can review connectivity and safe entry points. Planning analyses often focus on access and connectivity, so coordinate that information early.
● Acoustical Specialists
Acoustical specialists help when highways, rail, or industrial uses drive noise exposure. They define mitigation needs like setbacks, barriers, or façade upgrades for sensitive spaces. Furthermore, Digital tools can model noise quickly, but teams still must verify assumptions and sources. Autodesk Forma includes noise analysis options that support early decision comparisons.
● Utility Owners and Underground Locate Services
Meanwhile, utility owners and locate services help you validate what lies underground.
In the United States, 811 coordinates the marking of buried utilities before excavation starts.
However, locate marks show approximate positions, so confirm critical crossings with potholing. Then, update the diagram so the field team sees verified locations and protection needs.
● CAD Drafters and Technical Coordination
Finally, CAD drafters connect everyone’s inputs into a coordinated, readable sheet set. They manage xrefs, layering, and coordinate alignment so updates don’t break the drawing. Additionally, Autodesk recommends understanding xrefs and using them strategically for efficiency and flexibility. That discipline keeps the diagram reliable when consultants issue revisions.
Step-by-step Process for Reliable Site Evaluation in CAD Workflows
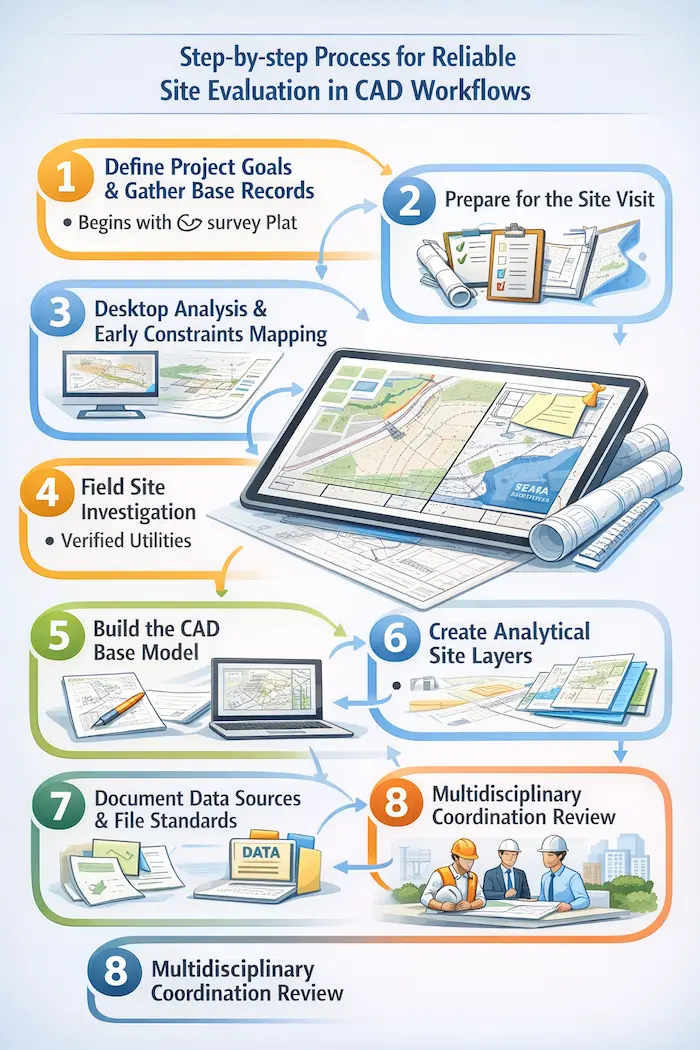
1. Define Project Goals & Gather Base Records
Begins with project goals, because goals tell you what to measure first. Next, collect record data, including deeds, plats, and any available title evidence. Then, pull base context like aerial imagery, surrounding streets, and known utilities. After that, request a current site survey, and confirm units, datum, and coordinate system.
2. Prepare for the Site Visit
Before the site visit, build a checklist tied to drawings, not to memory. Print a base plan at scale, and leave space for notes and dimensions. Also, review planning documents for stated constraints, because they influence what you verify. Then, schedule the visit after rainfall when possible, so drainage paths show themselves.
3. Desktop Analysis and Early Constraints Mapping
Then, use desktop sources to build an early constraints map before site visits. Download terrain data, hydrography, and contours so you understand drainage direction and relief. Also, check flood hazard layers, because they can affect finished grades and critical equipment. Finally, assemble climate expectations using official normals, not seasonal guesses.
4. Field Site Investigation
Step 4 moves onsite, where you verify access, visibility, and obvious conflicts. Photograph edges, note odors and noise, and mark observed drainage paths after rain. Measure critical items that drawings often miss, like steps, retaining walls, and curb heights. And then, log every observation with time and location so the team can reference it later.
5. Build the CAD Base Model
The next step turns raw notes into a CAD structure, starting with a consistent file setup. Set units, establish north, and attach surveys and base maps as external references. Clip xrefs to the study area, and lock them to prevent accidental edits. Then, run a quick overlay check to catch rotation, scale, or coordinate mistakes.
6. Create Analytical Site Layers
Then, draft separate analytic layers so reviewers can read one idea at a time. Create a constraints layer for setbacks, easements, flood limits, and protected features. Furthermore, create an opportunities layer for views, solar access, natural shade, and easy utility ties. Next, add a circulation layer for trucks, pedestrians, delivery staging, and emergency response.
7. Document Data Sources and File Standards
Add a notes layer that records assumptions in plain language, located near each callout. Also, create a data-sources block, because reviewers need to know what you relied on. Then, save the file to the agreed DWG version so partners can open it reliably. Autodesk explains that DWG formats vary by product release, so you must align versions early.
8. Multidisciplinary Coordination Review
The last step runs a coordination review with architects, civil engineers, and the construction team. Ask each discipline to confirm assumptions and mark missing data on the same sheet. Then, revise the diagram and update the notes so the record stays trustworthy. Finally, freeze a dated issue for estimating, and keep later updates in a controlled log.
Documentation & Quality Checks of Site Analysis Diagrams
Good documentation makes the diagram usable long after the first site walk. You need to start by listing every data source, including dates, versions, and coordinate references. Then, keep a photo log tied to callouts, so reviewers can confirm what you saw. Also, save consultant PDFs and GIS exports, because teams often need traceable backups.
Document your layer standards, so others can read the file without calling you. Name layers by discipline and topic, and keep annotations on separate plotting layers. Then, manage base files as xrefs, because xrefs preserve a clean separation of sources.
Common Mistakes Related to Site Analysis Diagrams
● Scale and Data Accuracy Issues
Common mistakes often start with scale problems, especially when someone traces screen captures. Instead, import geospatial data correctly, and label it as approximate when accuracy varies. USGS notes that some contour lines may not match across quadrangle boundaries. Therefore, you must validate grading decisions with a current survey and spot checks.
● Coordinate System and Geospatial Alignment Errors
Another mistake involves mixing coordinate systems, which shifts utilities and property lines silently. Civil 3D warns that point files from different coordinate zones require transformation. To prevent that, confirm the project coordinate system before importing any survey points. Then, add a note explaining the coordinate basis so future users don’t guess.
● Vertical Control and Elevation References
Teams also miss vertical control when they ignore datum, benchmarks, and finished floor intent. Write the vertical datum clearly, and confirm whether elevations reference sea level or the local bench. Then, mark any assumed finished grades as assumptions, not as approved design targets. This discipline prevents field laborers from treating early diagrams as issued-for-construction drawings.
● Underground Utility Verification
Teams also miss underground risk when they copy old utility maps without verification. However, 811 only marks the approximate location of buried utilities after a request. Plan potholing where the diagram shows conflicts, and record results as verified updates. That workflow keeps the site analysis diagram aligned with real discoveries in the field.
● Construction Sequencing Considerations
Another common mistake is forgetting construction sequencing, so staging conflicts appear too late. Add notes about access windows, lane closures, and neighbor-sensitive times when known. Then, coordinate those notes with noise and connectivity considerations from planning documents.
● Diagram Clarity and Readability
Finally, teams overcomplicate diagrams by stacking everything on one unreadable sheet. Instead, publish focused sheets with consistent symbols and a clear legend for each topic. Also, avoid vague notes like verify, and specify who verifies and when they verify. These small habits reduce misinterpretation during estimating, permitting, and construction meetings.
Modern Methods Used in Site Analysis Diagrams
● Drone Mapping and Aerial Data Collection
Modern site analysis starts with better data capture, and not louder opinions. In this game, drone mapping can generate orthomosaics and surface models for earthwork planning.
● LiDAR Terrain Data
Public LiDAR programs, like USGS 3DEP, provide terrain data that supports planning. USGS describes 3DEP as a national LiDAR collection that delivers 3D information for mapping. Elevation data also supports flood risk management, which affects grading and critical equipment. USGS notes that 3DEP elevation helps assess and communicate flood risk information.
● Laser Scanning and Scan-to-BIM Modeling
Laser scanning supports tight sites where tape measures miss hidden existing geometry. Scan to BIM converts point clouds into BIM-ready models for coordinated planning. Autodesk describes Scan to BIM as translating point clouds into BIM models for teams. Still, the anchor scans to survey control, or the model drifts off real coordinates.
● Early Environmental Analysis Tools
Software now supports faster early checks for noise, sun, and solar potential. Use the results as decision support, and record assumptions beside each diagram callout. That habit keeps your work defensible when tools update models or datasets later.
Upgrade your site analysis with modern mapping and BIM-ready tools — get accurate, actionable insights before construction begins.
Frequently Asked Questions
What’s the difference between true north and project north on drawings?
True north points to geographic north, while project north aligns with the drawing grid. Show both when possible, because sun studies and survey bearings depend on orientation. Then, note which north the sheet uses, so crews don’t rotate layouts accidentally.
What should you ask a surveyor to deliver besides a stamped PDF?
Request a DWG base plan with layers, line types, and coordinate system metadata. Also, request point files or surface data if you plan to grade and model utilities.
How to share the diagram with owners who don’t open CAD files?
Export a vector PDF at a fixed scale, and include a graphic scale bar. Use clear lineweights and a legend, because printers can wash out light layers. Then, attach the PDF to the meeting minutes, so decisions remain traceable.
Can you rely on satellite imagery for dimensions, slopes, or property corners?
Use imagery for context, but do not scale it for boundary or grading accuracy. Pair imagery with survey control and authoritative elevation sources, then verify in the field.
What to do when the diagram and field disagree mid-project?
Stop treating the diagram as correct, and treat it as a hypothesis needing revision. Verify critical points with a survey, locate marks, or scan tied to control. Then, issue an updated site analysis diagram and brief the team before work continues blindly.
Conclusion
A professional site analysis diagram doesn’t replace judgment, but it makes judgment visible and reviewable. It links survey, codes, climate, and field notes into one coordinated drawing set. Then, contractors, architects, and estimators discuss the scope without arguing over missing context.
While working on site analysis diagrams, ensure that you keep layers clean, sources dated, and write assumptions in easy-to-read and understand words. When conditions change, update the diagram quickly and communicate the revision clearly. That’s how you build trust across trades and keep decisions tied to evidence. Most importantly, treat site analysis as a drafted deliverable, and your project stays grounded.
And if you are someone already struggling with a bundle of duties and looking for the professionals for site analysis diagrams, contact CAD Drafters; the company has been providing trustworthy services for 2+ decades. Contact and share your project details now!